
Technical document for the decadal forecast ensembles of Canada
On this page
- Introduction and overview
- Data and processing
- Analysis and calculation
- Calculation of anomalies
- Averaging of ensemble members per model
- Regridding and masking
- Calculation of rolling average
- Ensemble percentiles
- Maps
- Dataset licence
- Contact
- References
- List of acronyms
Introduction and overview
Environment and Climate Change Canada is responsible for providing Canadians with information on past and future climate change. This knowledge can be used for climate impact assessments, adaptation planning, and the development of mitigation policies. This includes near-term decadal forecasts across Canada.
The results from this analysis are based on annually updated multi-model forecasts from the World Meteorological Organization (WMO) Lead Centre for Annual to Decadal Climate Prediction. These forecasts are analyzed in the Global Annual to Decadal Climate Update reports. These sources provide forecasts for the next five years. However, most of the individual model forecasts gathered by the Lead Centre extend out to 10 years. The decadal forecasts for Canada described here cover this 10-year range.
For global decadal forecasts, please consult the WMO website and report. For decadal forecast information specific to Canada, please visit the CCDS webpage.
This document outlines the process used to prepare the multi-model decadal forecasts for Canada. These datasets include near-term forecasts on a seasonal and annual temporal scale over a decadal period. The datasets are presented as anomalies averaged across 5-year intervals, compared to the reference period of 1991 – 2020. Please see Table 1 below for more information on these datasets.
Table 1. Key features of the datasets.
- Variables and units
-
Near-surface air temperature in degrees Celsius averaged over the season or year.
Daily rate of precipitation in mm/day averaged over the season or year.
- Available products
-
Gridded datasets in NetCDF format
Maps in .png format
A table of user-selected points is available to download in CSV format
All results are expressed as anomalies (relative to the historical reference period)
- Geographic area
Canada
- Spatial resolution
Regridded to a 1x1 degree grid using nearest neighbour interpolation
- Temporal resolution
-
Seasonal: 5-year rolling average of seasonal anomalies
Annual: 5-year rolling average of annual anomalies
- Time Period
-
Historical reference period (climatology): 1991-2020
Forecast Period: 10 years starting with the current year. For example, January 2024 – December 2033
- Percentiles
-
5th, 25th, 50th (median), 75th, and 95th percentiles
Multi-model ensemble percentile datasets provide information on the spread or range of decadal forecasts across the contributing models. Each model's runs are averaged so that all models contribute equally to the final ensemble. The average for each model represents that model’s average forecast. The percentiles represent the range of those averages across all models.
Data and processing
Data download and model list
All data is processed using scripts executed on a Unix system in a GNU Bash shell environment. Monthly global forecast data for precipitation and temperature were provided by the WMO Lead Centre and masked for Canada.
Forecast data was sourced from 15 modelling centers, each contributing multiple ensemble (realization) members for a total of over 180 members. Each modelling center forecasted both temperature and precipitation, except for the Naval Research Laboratory (NRL), which only forecasted temperature. A list of the included models and some of their details is available below in Table 2.
Preprocessing
Python version 3.11.11 was used for preprocessing. The first step was to align all model outputs to the same calendar type and period. To compute forecast periods, the datasets were isolated from the start year to the end year using the “reindex” function from xarray (version 2024.11.0). This function also fills missing data points with “NaN”.
For example, this included forecast data from the Meteorological Research Institute (MRI) and the Russian Academy of Science (RHMC) in the 2024 – 2033 forecast. Forecast data from these models only covered the period between January 2024 and December 2028 for both variables. For these models, the remaining 5 years of the forecast period were filled with NaN (2029 – 2033). A similar procedure is done for missing model data across different forecast periods.
After configuring calendar types, the “transpose” function from the Python library NumPy (version 1.26.4) transposed all datasets. This process reformats ‘time’ to the first dimension for each variable. This is followed by the coordinate dimensions (latitude and longitude), and finally, ensemble members as the final dimension.
Analysis and calculation
Calculation of anomalies
The WMO provides anomalies (A) for each variable. Anomalies are calculated by subtracting the average for the historical reference period of 1991-2020 (μ) from the monthly forecasted values (x). The expression below shows an example of this calculation for the 2024 – 2033 forecast period:
Averaging of ensemble members per model
Python version 3.10.4, ESMValTool, and CDO (version 2.0.5) were used to analyze decadal forecasts and to calculate the results. Python was used to average the anomalies across all members for each model. This process accounts for the varying number of ensemble members among models and equalizes the contribution from each model to the multi-model ensemble. Specifically, the “np.mean” function from the Python Library, NumPy, was used to calculate the average across members for each model before creating percentiles.
Regridding and masking
The model datasets were interpolated to a common 1x1 degree global grid using CDO’s nearest neighbour remapping function (remapnn). After regridding, the Python library Xarray was used to mask global data from each model to Canada.
Calculation of rolling average
There is uncertainty when using modelled forecast data, particularly when looking at individual monthly or seasonal averages. To reduce the uncertainty, 5-year rolling averages are provided. For example, the average over the 10-year range may include the periods 2024 – 2028, 2025 – 2029, 2026 – 2030, 2027 – 2031, 2028 – 2032, and 2029 – 2033. The rolling averages are indexed to the central year of their respective periods. As an example, the average for the 2024–2028 period is labelled by the year 2026. The model must have data for all five years of the rolling average period. If the model does not, it is excluded for that period.
A rolling average smooths the anomaly field for each model by averaging the annual or seasonal anomalies over five years at each coordinate in the dataset. The results are a 5-year rolling average for each temporal scale on a 1x1 degree grid of Canada. The calculation for this analysis can be simplified using the following equation. In this expression, x is the central year of the period, a is the anomalies for the defined coordinates, and A is the 5-year rolling average of anomalies at the defined coordinates:
Ensemble percentiles
Multi-model ensemble percentiles of decadal forecasts for each variable were calculated using CDO. This includes the 5th, 25th, 50th (median), 75th, and 95th percentiles. Percentile statistics can provide some insight into the range of uncertainty across model projections. For more information, please see Table 1 and Table 2 below. For a breakdown of the process to calculate these percentiles, please refer to Figure 1.
Maps
Maps were generated in Python using MatPlotLib (version 3.8.4) and Cartopy (version 0.23.0) on a North Polar stereographic map of Canada.
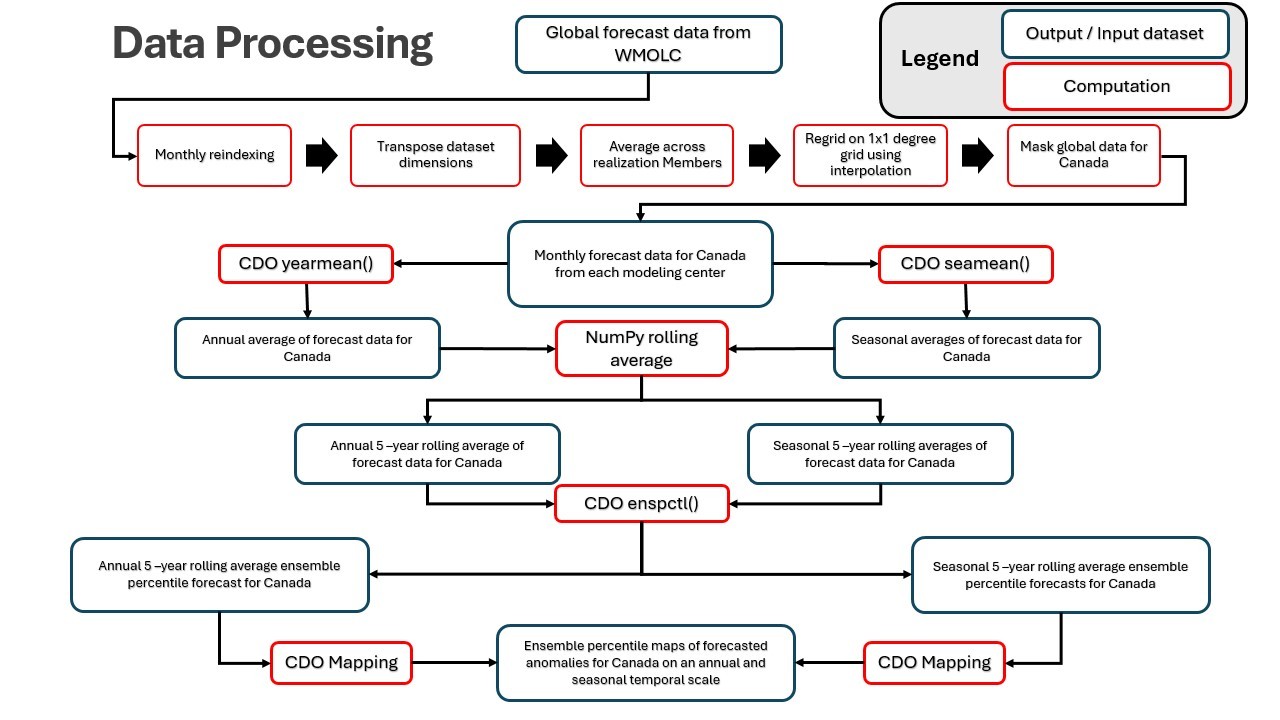
Figure 1. The process to transform global monthly decadal forecasts into a 5-year rolling average of ensemble forecasted anomalies for Canada.
Table 2. The list of modelling centers and the number of ensemble members available for each model for the 2024-2033 forecast.
| Modeling center | Modelling center name | Model | Number of ensemble members for temperature | Number of ensemble members for precipitation |
|---|---|---|---|---|
| BCCR | Bjerknes Centre for Climate Research | NorCPM1 | 23 | 30 |
| SMHI | Swedish Meteorological and Hydrological Institute | EC-Earth3 | 10 | 10 |
| CCCma | Canadian Center for Climate Modeling and Analysis | CanCM4 | 10 | 10 |
| CMCC | Euro-Mediterranean Centre on Climate Change | CMCC-CM2-SR5 | 20 | 20 |
| DWD | Deutscher Wetterdienst | MPI-ESM-LR_hckf405s | 16 | 16 |
| LASG | The State Key Laboratory of Numerical Modeling for Atmospheric Sciences and Geophysical Fluid Dynamics | FGOALS-f3-L | 9 | 9 |
| MIROC | Japan Agency for Marine-Earth Science and Technology | MIROC6 | 10 | 10 |
| MOHC | The UK Meteorological Office | HadGEM3-GC31-MM | 10 | 10 |
| MRI | Meteorological Research Institute | MRI-ESM2-0 | 10 | 10 |
| GFDL | Geophysical Fluid Dynamics Laboratory | GFDL-SPEAR_LO | 10 | 10 |
| IITM-MoES | Indian Institute of Tropical Meteorology | IITM-MoES | 10 | 10 |
| IPSL | Institut Pierre-Simon Laplace | IPSL-CM62-ESMCO2 | 10 | 10 |
| NRL | Naval Research Laboratory | Lean&Rind (2009) | 1 | N/A |
| NCAR | National Center for Atmospheric Research | NCAR | 20 | 20 |
| RHMC | Institute for Numerical Mathematics, Russian Academy of Science | INM-CM5 | 15 | 15 |
| Total | 184 | 190 |
Dataset licence
Open Government Licence - Canada (http://open.canada.ca/en/open-government-licence-canada)
Individual model datasets and all related derived products, including the multi-model ensembles, are subject to the terms of use of the source organization.
Some of the contributing centers currently provide their data on open-source channels. For more information about a specific model, please contact the appropriate modelling center.
Contact
For more information about the multi-model ensemble datasets of decadal forecasted anomalies for Canada available on CCDS, please reach out to ECCC using the following contact: f.ccds.info-info.dscc.f@ec.gc.ca
List of acronyms
- CCDS
Canadian climate data and scenarios
- WMO
World Meteorological Organization
- ECCC
Environment and Climate Change Canada
- Bash
Bourne Again Shell
- CDO
Climate Data Operators
- NCO
NetCDF Operators
- NaN
Not a number